

Use Statistics to review recorded control maturity and completion across the policy scope. Access to assessment analytics requires the relevant confidential-details permission and enabled workspace features.
Understand the scope
The register provides a workspace-level view. Opening a policy and choosing Statistics focuses the view on that policy. Check the selected policy and version before comparing results.
The statistics panels show controls assessed, mean completion, mean current maturity and mean target maturity, together with counts of policies, categories, subcategories and controls.
These analytics roll up values from controls. A parent's separately recorded assessment value or description is not automatically the same number as the mean of its underlying controls.
Read the charts
Switch between Current and Target, then choose Radar, Sankey or Heatmap. Review maturity by category, completion by category and the completion distribution.
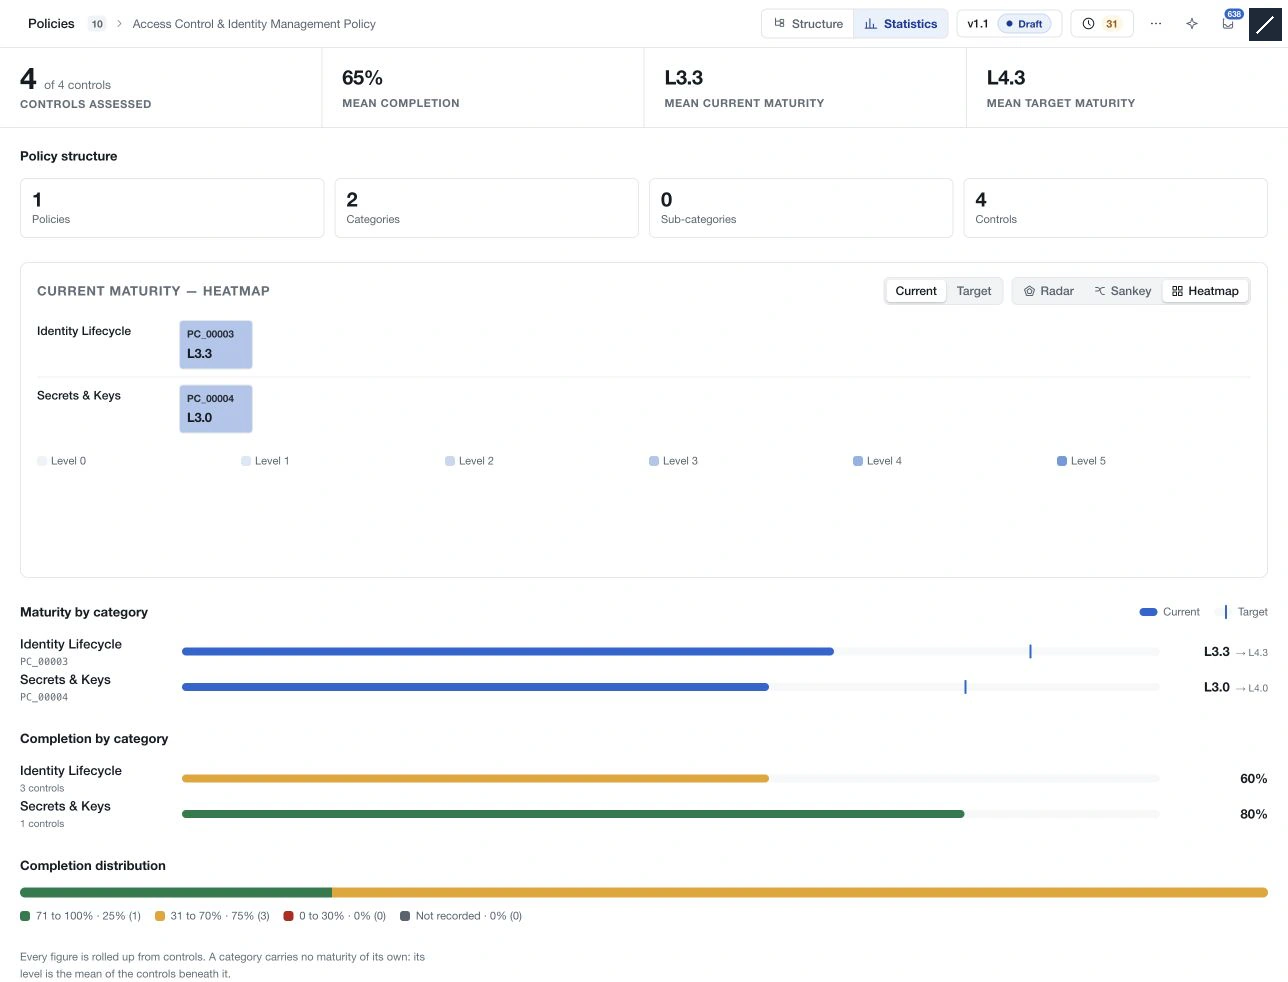
Read the assessed population and Not recorded category alongside averages. Missing information does not demonstrate a measured zero or successful implementation. A high completion percentage also does not independently prove operating effectiveness.
For a scope containing only one or two groups, a heatmap or category list can be easier to interpret than a radar chart.
Find the underlying elements
Return to Structure and search the policy by code or name. Filter narrows the tree by category, subcategory or control; selections apply directly. Use All element types to clear the type filter and clear the search field separately.
For review campaigns across policies, use Controls and its broader completion, maturity, organisational and classification filters. Verify the underlying control before changing an assessment based on a summary view.