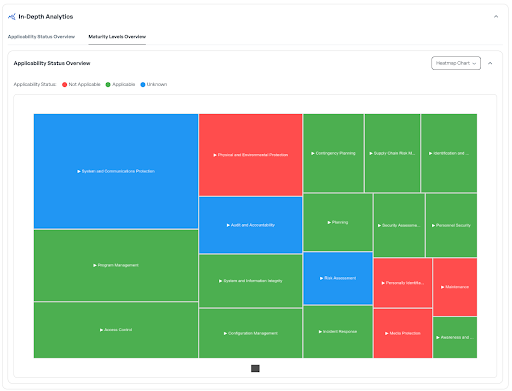
Leverage advanced visualisation tools, including Sankey charts and heatmaps, to gain a comprehensive overview of your frameworks.
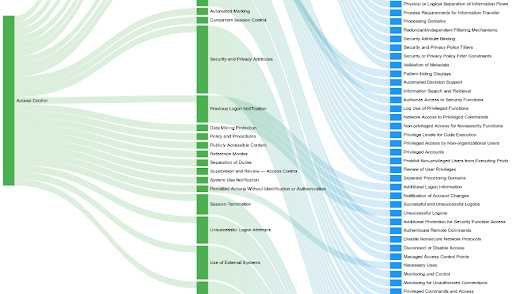
Both graphs provide insights into applicability status and maturity levels, offering a clear visual representation of frameworks, domains, categories, and subcategories to help you track progress and alignment with organisational goals.
Sankey charts
Maturity Levels with Sankey charts Overview example:
Heat map
Applicability Status with heat map example