

Each framework comes with a statistics panel and structure filters that give you a clear view of applicability, maturity and progression across domains, categories and subcategories.
1. The Statistics Panel
Open a framework and use the statistics toggle to show or hide the panel. It offers three perspectives:
- Overview: the overall framework progression (elements with implementation progress) and the implementation status distribution.
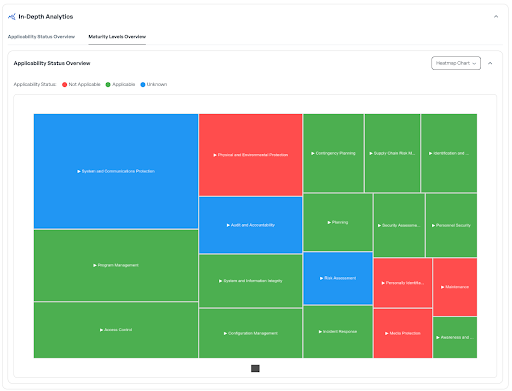
- Applicability: how Implemented, Not Implemented, Not Applicable and Unknown statuses are distributed across the structure.
- Maturity: current and target maturity levels for every element.
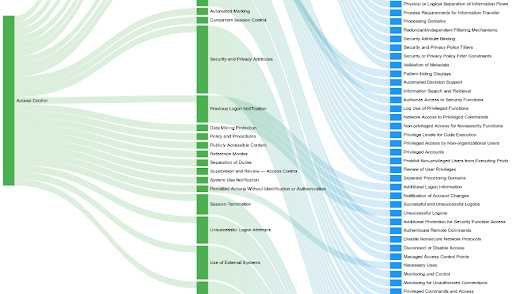
Applicability and maturity can each be rendered as a Radar, a Sankey chart or a Heatmap; click a domain or category to drill into its sub-items.
Maturity levels with a Sankey chart:
Applicability status with a heatmap:
2. Filtering the Framework Structure
In the Framework Structure panel, open the Filters drawer to narrow down what you see:
- Search: find elements by code or name.
- Applicability Status: show only elements with a given status.
- Policy Control Links: show only elements whose link status is Complete, Partial, Missing or Not Required.
Combine filters with Apply Filters, and reset them with Clear All. Expand or collapse the whole tree in one click to move quickly through large frameworks.