

The Dashboard combines the workspace's current posture, assessment coverage and work requiring attention. Start with Executive summary, then follow the relevant records to understand the decisions and evidence behind a number.
The dashboard respects your access. A colleague with different permissions or a different record scope may see different widgets and figures. Check the selected workspace, the reporting entities and any source or refresh message before comparing results.
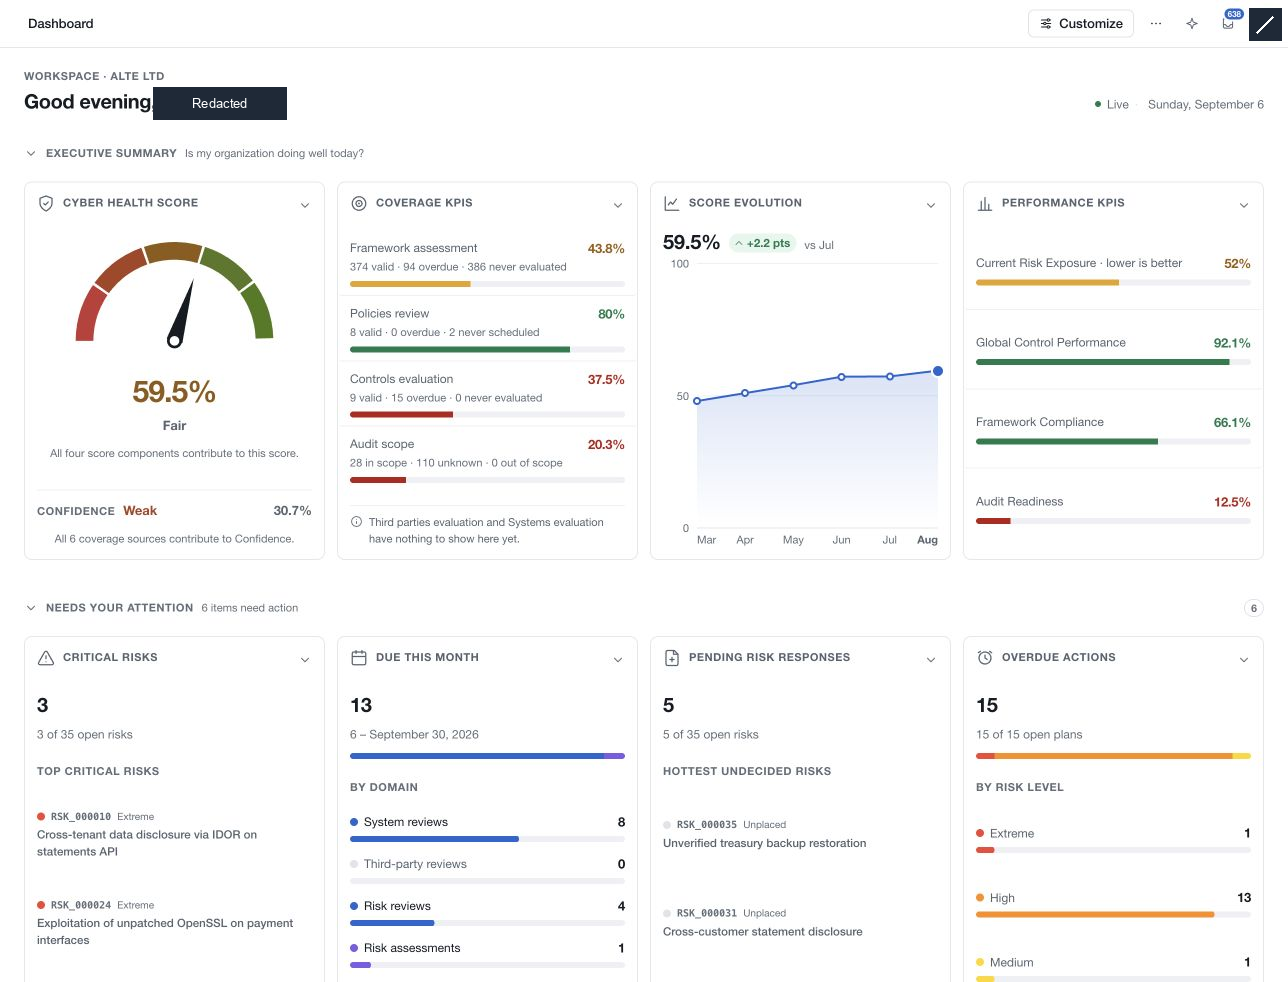
Read performance and coverage together
The executive summary separates two questions:
- Cyber Health Score summarizes performance against the recorded targets, using risk exposure, control performance, framework compliance and audit readiness.
- Confidence summarizes assessment coverage and freshness. It helps you judge how representative the performance score is.
Performance KPIs shows the four health components; Coverage KPIs shows the coverage indicators. Confidence is independent of the Cyber Health Score and is never multiplied into it. A strong performance score with weak coverage calls for further assessment, not an assumption that the unassessed environment performs equally well.
Cyber Health Score
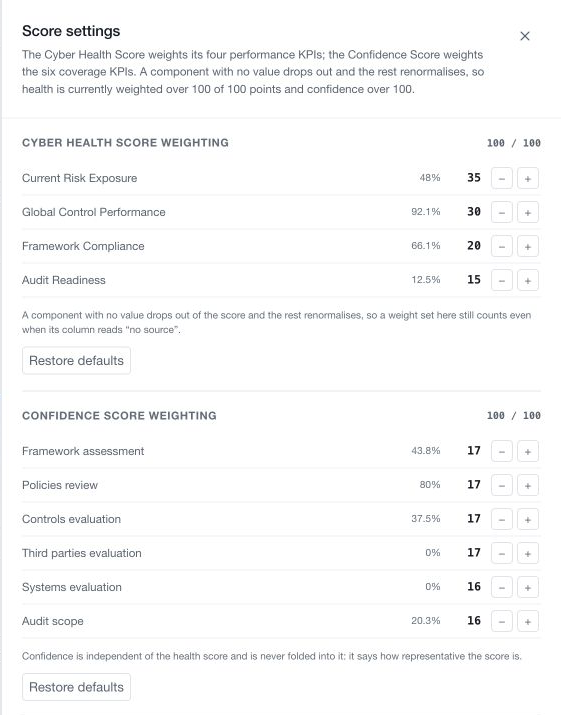
The score is a weighted average on a 0–100% scale. Its default weights are:
| Component | Default weight |
|---|---|
| Risk score: 100 − Current Risk Exposure | 35% |
| Global Control Performance | 30% |
| Framework Compliance | 20% |
| Audit Readiness | 15% |
For the components with a computable value:
Cyber Health Score = sum(component value × configured weight)
                     ÷ sum(weights of those components)
The risk component is inverted because lower exposure is better. For example, 52% Current Risk Exposure contributes a risk score of 48% before weighting.
A component with no computable value is excluded and the remaining weights are scaled proportionally. A computed 0% remains a real result; it is not treated as missing. If no positively weighted component has a value, there is no computed score.
The dashboard uses five score bands: Critical below 20%, Weak from 20% to below 40%, Fair from 40% to below 60%, Good from 60% to below 80%, and Excellent from 80% to 100%. These describe the composite score; they are not the severity labels in your configurable risk matrix.
The four performance KPIs
Current Risk Exposure
Each open risk placed on the current risk matrix contributes its likelihood multiplied by its impact. The aggregate compares those scores with the maximum possible total for the same number of placed risks:
Exposure = sum(likelihood × impact)
           ÷ (placed open risks × maximum matrix cell score) × 100
Every placed open risk counts, including low-severity risks. Closed and cancelled risks are excluded. Unplaced risks do not have a matrix score; review the separate unassessed count rather than treating them as low exposure.
Global Control Performance
For each control with a current maturity and a positive target maturity, the calculation combines progress toward the target with completion of the remaining gap, capped at 100%.
For example, current maturity 2 against target 4 gives 50% maturity achievement. If completion is 50%, it contributes half the remaining gap, for 75% achievement overall.
The KPI averages those achievements using each control's weighting. Controls without the required evaluation values cannot contribute to this performance calculation; inspect evaluation coverage to understand the missing scope.
Framework Compliance
An assessed requirement contributes its current maturity divided by its positive target maturity, capped at 100%. The KPI averages those ratios using the requirement weightings.
The reporting framework selection controls the scope. With All frameworks, evaluated requirements across the workspace contribute. A newly imported framework with no evaluated requirements can lower assessment coverage without lowering this evaluated-only compliance average. Do not confuse the two indicators.
Audit Readiness
Audit Readiness measures completion of recommendations in the reporting audit. Recommendations are weighted by priority. When a recommendation has actions, completion is the priority-weighted share of actions closed; without actions, its own recorded completion determines whether it is complete.
This is a measure of recommendation follow-through. It is not a certification decision or a guarantee that the organization will pass an external audit.
Confidence and coverage
Confidence uses six coverage sources with these default weights:
| Coverage source | Default weight | What contributes as covered |
|---|---|---|
| Framework assessment | 17% | Applicable requirements with an assessment whose scheduled review, if any, is not overdue; respects the reporting framework selection |
| Policies review | 17% | Policies whose current version has an active review schedule with a next review date that is not overdue |
| Controls evaluation | 17% | Controls with a current maturity and no overdue scheduled review |
| Third parties evaluation | 17% | Third parties with linked assessment validity extending into the future; weighted by tier |
| Systems evaluation | 16% | Systems with linked assessment validity extending into the future; weighted by criticality |
| Audit scope | 16% | In-scope elements divided by in-scope plus undecided elements in the reporting audit; explicitly out-of-scope elements are excluded |
Third-party weights are 5 for Tier 1, 3 for Tier 2 and 1 for other tiers. System weights are 5 for Critical, 1 for Non-Critical and 3 for the remaining classification. The other coverage indicators use item counts rather than those criticality or tier weights.
Read the state labels for each source. Framework and control evaluations distinguish valid, overdue and never evaluated. Policy review coverage distinguishes valid, overdue and never scheduled. Audit scope uses in scope, unknown and out of scope. These are related coverage ideas, not one identical workflow.
As with health, a source without a computable coverage value drops out of the weighted average. A source with existing items and 0% valid coverage still contributes zero. The Coverage KPIs widget can omit a zero-valued row while that value remains part of Confidence; use Score settings to inspect the contributing values.
Coverage can decline as review or validity dates pass, even when nobody edits a record. A stale assessment can remain part of the history while no longer counting as current coverage.
Configure scores and reporting entities
Use Configure score settings on the Cyber Health Score widget when your permissions allow it. Adjust the health weights and confidence weights independently. Each group must total exactly 100. Restore defaults restores the values for its group; review the draft before saving.
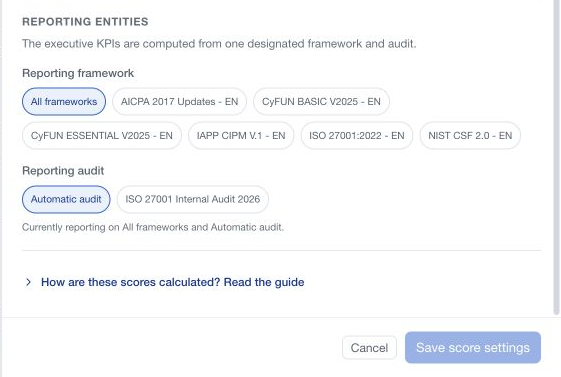
Choose a Reporting framework, or All frameworks, for the framework performance and assessment coverage indicators. Choose a Reporting audit, or keep Automatic audit. Automatic selection prefers an audit with scope over an empty audit, then uses the applicable status and recency ordering; an explicitly selected audit takes precedence. Check the effective audit shown on the dashboard.
Choose Save score settings and wait for confirmation. These are workspace reporting settings, not a private reinterpretation of the score in your browser. Weight and reporting changes are recorded as workspace settings activity.
Follow work that needs attention
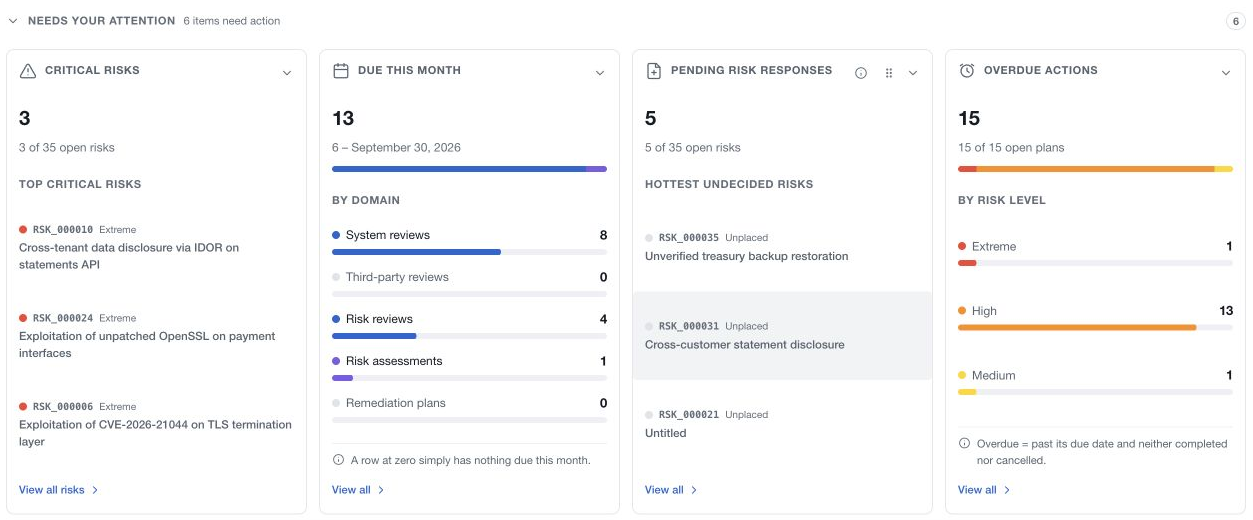
Needs your attention links the overview to actionable records. Review critical risks, pending risk responses, overdue remediation and upcoming due dates. No Schedule and No Owner describe the registers named by their widgets; they do not count every object type in the application.
Risk management provides the assessment pipeline, remediation overview, risk heat map and trend views. Use Current, Inherent or Target on the heat map to inspect the intended perspective, then follow a populated cell to the corresponding risk list. The unassessed count explains risks that cannot be placed on that matrix view.
Compliance overview brings framework, policy and audit progress together. Operational overview links to the underlying registers and provides quick actions. Activity & setup shows recorded recent activity and configuration steps; a completed setup checklist does not establish the effectiveness of the controls you configured.
History, layout and troubleshooting
Score evolution uses recorded monthly snapshots and the live value for the current reporting month. Missing history remains a gap; a new workspace cannot show snapshots that have not yet been collected. Read the displayed month and comparison label rather than assuming a percentage-point change refers to the same period in every widget.
Use a widget's information control for its explanation. Collapse sections or individual widgets to focus the page, and use the reorder controls where available to arrange the overview.
If a number surprises you, check its scope, assessment state, due dates, reporting settings and source availability before changing the data. Dashboard counts, evaluated-only performance averages and coverage percentages answer different questions. Follow the record links to investigate the underlying population.